The UCSC Genome Graphs is an online tool that allows users to upload
and display datasets across the genome. We recommend using Genome
Graphs if you are interested in a having a general overview of
Eurexpress expression data in relation to the genome. We have recorded
the location on the chromosome for each probe used in all Eurexpress templates.
This information can be viewed via the Genome Graphs at the UCSC Browser's site
by following the instructions below.
Click on the link below to see the chromosome position of all Eurexpress probes in a new window
Go to UCSC Genome Graphs:
Eurexpress Probes viewed in Genome Graphs
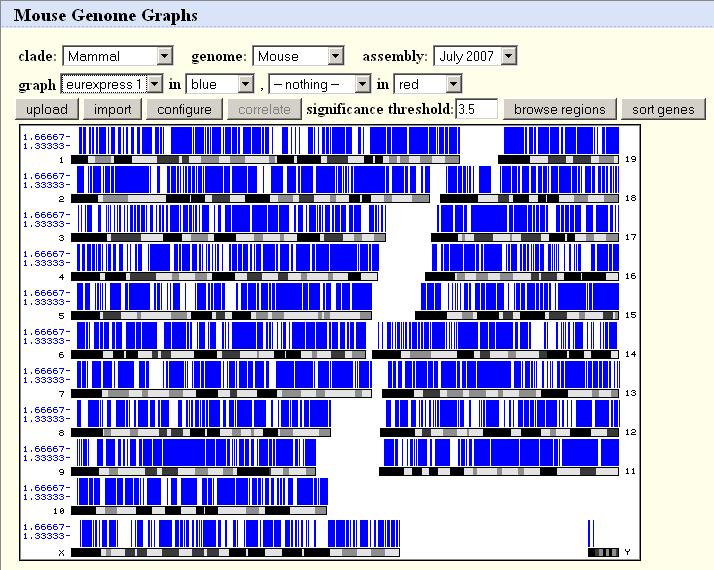 |
You can select different datasets in the dropdown list labeled graph.
The dataset selected by default in the dropdown list is 'allprobes1'. This is the set
of all the probes used in the Eurexpress project.
Other datasets at the moment show the probes for genes that were expressed in only one set of
structures exclusively, eg. heart_only1 shows genes that were found to be expressed only in the
heart and its substructures, but nowhere else in the mouse anatomy. More datasets for different
categories will be generated in the future for display in Genome Graphs.
Click on any part of a chromosome to view the probes of that region in closeup on the Genome Browser.
|
Clicking on a region of a chromosome in the Genome Graphs page will automatically
take you to the Genome Browser like the example shown below:
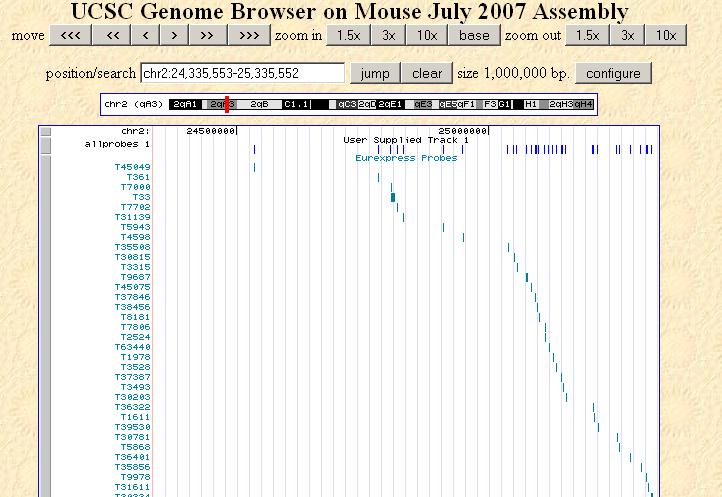 |
This page shows the Genome Browser, a tool that can be accessed
from the Genome Graphs by clicking on a region of the displayed genome. The area of
the chromosome you select will be magnified in the Genome Browser, showing the location of
the probes in relation to other tracks provided by the UCSC Browser.
You can navigate across the current chromosome by using
the move and zoom in/out buttons located at the top of the page. By clicking on
the numbered scale you can also zoom into a specific area. You can also view
a different chromosome by entering the chromosome position in the position/search
textbox, or go back again to the Genome Graphs to click on a different area of the genome.
Note that on this page there is an extra track titled 'Eurexpress Probes' that shows
all the probes used in the Eurexpress Project labeled by template ID.
|
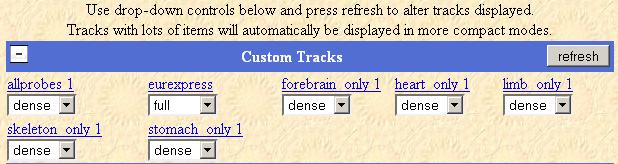 |
The Genome Browser displays all available datasets by default. You
can hide a specific Eurexpress track by scrolling down to the configuration settings titled
Custom Tracks on the same page. Select 'hide' from the dropdown list to hide
a track, 'full' to display the most detail and 'dense' to display everything in one row.
Remember to click the refresh button to view the changes!
You can also hide or display any of the other tracks provided
by UCSC in the configuration settings for the other track categories in a similar way.
|
Finally, if you want more information on the Eurexpress experiment that each probe was involved in,
you can click on the template ID-labeled probes in the 'Eurexpress Probes' track. This will take
you to the following page with a link back to the Eurexpress website for the template you
select.
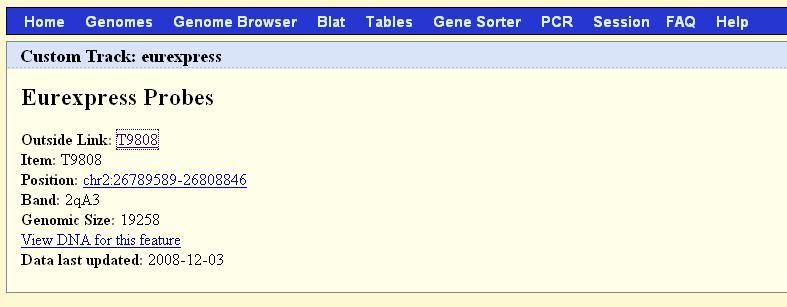 |
Click on the Template ID link labeled Outside Link on this page
to go back to the Eurexpress page that displays the information for the specified template.
|
For further information and detail on using the:
- UCSC Genome Graphs:
UCSC Genome Graphs introduction page
, which has a link a separate tutorial page if needed.
- UCSC Genome Browser:
Genome Browser User Guide
, and UCSC Browser's FAQ page.
|